This page contains additional data supporting our resource reported in:
Single-cell transcriptome profiling of human pancreatic islets in health and type 2 diabetes
Åsa Segerstolpe*, Athanasia Palasantza*, Pernilla Eliasson, Eva-Marie Andersson, Ann-Christine Andreasson, Xiaoyan Sun, Simone Picelli, Alan Sabirsh, Magnus Bjursell, David M. Smith, Maria Kasper, Carina Ämmälä and Rickard Sandberg
*co-first authors
Published in Cell Metabolism (2016)
Links to download the complete single-cell transcriptome resource as raw FastQ files in ENA or processed expression data in ArrayExpress E-MTAB-5061.
Search for an official gene name to explore its expression across the single-cell gene expression resource
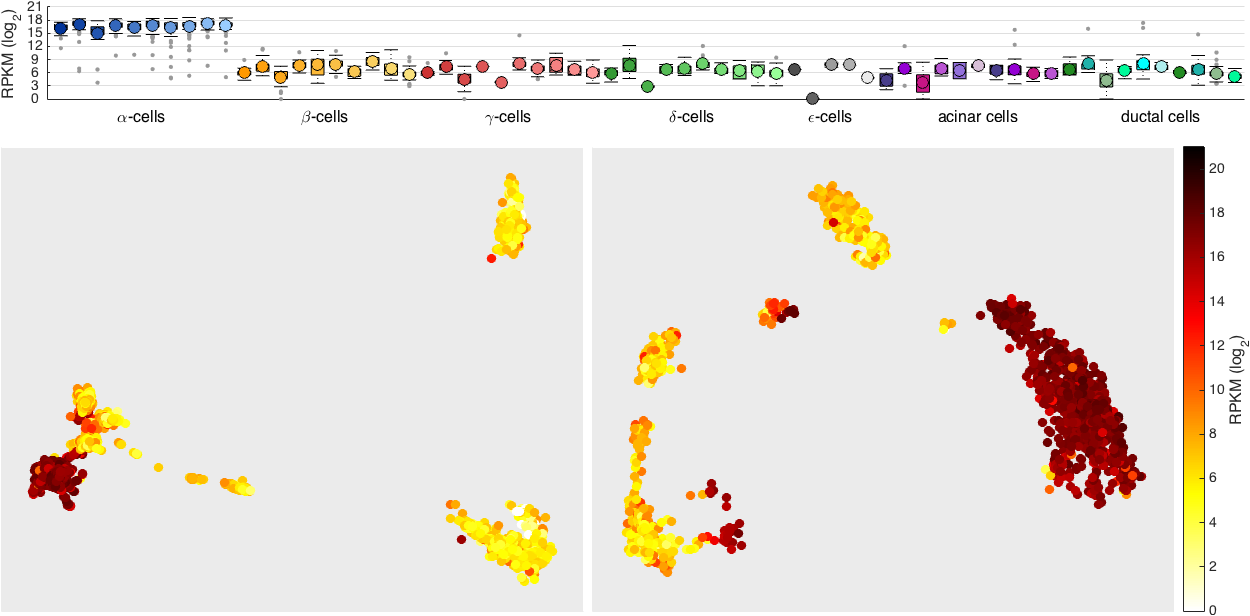
Boxplots summarising GCG expression levels across the 7 major cell types (shown in different colors) for every donor (shown in different shades of each color). The first 6 boxes correspond to healthy individuals (H1 to H6) and the last 4 to T2D individuals (T2D1 to T2D4). ε-cells were captured only in 5 donors (H2, H3, H6, T2D1, T2D4). t-SNE representations colored according to GCG expression levels of: (Left) all sequenced cells (n=2,209) or (Right) endocrine cells only (n=1,554). Compare with the corresponding t-SNE graphs/maps shown below (reproduced from Figure 1 of the paper).
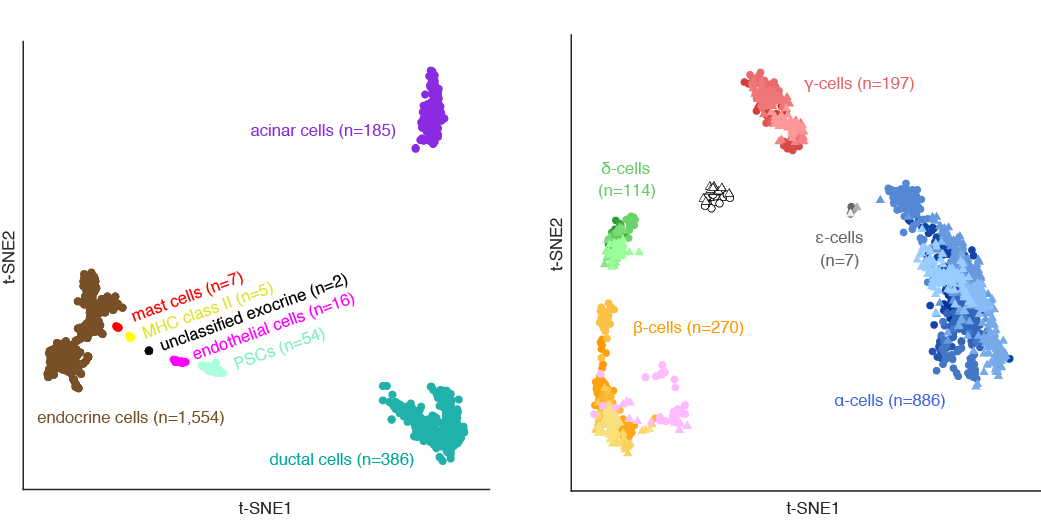
Reproducing Figs 1B and 1E of Segerstolpe, Palasantza et al. to show the placement of cell types onto the t-SNE maps.
Single-cell transcriptome profiling of human pancreatic islets in health and type 2 diabetes
Åsa Segerstolpe*, Athanasia Palasantza*, Pernilla Eliasson, Eva-Marie Andersson, Ann-Christine Andreasson, Xiaoyan Sun, Simone Picelli, Alan Sabirsh, Magnus Bjursell, David M. Smith, Maria Kasper, Carina Ämmälä and Rickard Sandberg
*co-first authors
Published in Cell Metabolism (2016)
Links to download the complete single-cell transcriptome resource as raw FastQ files in ENA or processed expression data in ArrayExpress E-MTAB-5061.
Search for an official gene name to explore its expression across the single-cell gene expression resource
Visualizing GCG expression across human pancreas:
Boxplots summarising GCG expression levels across the 7 major cell types (shown in different colors) for every donor (shown in different shades of each color). The first 6 boxes correspond to healthy individuals (H1 to H6) and the last 4 to T2D individuals (T2D1 to T2D4). ε-cells were captured only in 5 donors (H2, H3, H6, T2D1, T2D4). t-SNE representations colored according to GCG expression levels of: (Left) all sequenced cells (n=2,209) or (Right) endocrine cells only (n=1,554). Compare with the corresponding t-SNE graphs/maps shown below (reproduced from Figure 1 of the paper).
Reproducing Figs 1B and 1E of Segerstolpe, Palasantza et al. to show the placement of cell types onto the t-SNE maps.